
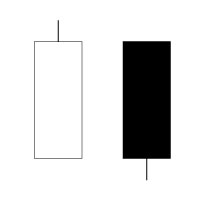
Another single candlestick pattern, the belt holds pattern has two variations: the bullish belt hold and the bearish belt hold. The bullish belt holds candlestick easily be distinguished as a long white candlestick with a short wick at the top, indicating that the opening price was the low of the day, with the close just short of the day’s high. The bearish belt holds, on the other hand, is a long black candlestick with a short wick at the bottom, showing that the stock fell through the day and closed just above its lowest point. This is an easily recognizable pattern even for beginning investors.
Both types of belt holds candlesticks indicate a portending market trend reversal. A bullish belt hold by definition forms during a downward trend while a bearish belt hold always occurs during an upward trend. In both cases, the market is making a strong move against the current, a move that may have the effect of completely reversing the tides. Although these candlesticks are essentially polar opposites of each other, they both predict the same result: a turn-around in trend sentiment.
Your Next Move
While both of these candlestick patterns predict a reverse in trend either from bullish to bearish or from bearish to bullish, this is not a prediction that can be acted on without other factors pointing to the same future events. Both versions of the belt holds pattern can occur on a regular basis and do not always correctly predict a change in share prices or general movement. The belt holds pattern can be a onetime movement and have little effect on the whole trend, especially if the candlestick is relatively short. As such, a smart investor will not act on a belt holds candlestick pattern without strong confirmation.
Confirmation
As with almost all single candlestick patterns, a trend that displays a belt holds pattern should be watched for at least two days and only acted upon when confirmation has presented itself on the next trading day. In this case, confirmation of the marked change in direction that a bullish belt hold suggests could include a white candlestick, a gap up, or another higher closing price. Similarly, the prediction made by a bearish belt hold might be confirmed by a black candlestick, a large gap down, or another lower closing price.


