
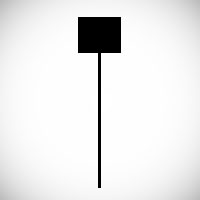
People who are familiar with the hanging man candlestick pattern will find that the hammer looks almost identical, except that it is found at the end of a downtrend instead of at the end of an uptrend. This candlestick has a small body, with a difference of just a few points that is located above a longer wick. There may be a small upper wick, but usually, there is none at all. The candlestick body can be black or white, although a white candlestick is more standard and more suggestive of upward movement in the future.
By definition, the hammer occurs after a downward trend in price. On the day that the hammer occurs, the market was distinctly bearish but rebounded by the end of the day to near its opening price. This suggests that the downward momentum previously seen has been broken or at least weakened.
In general, the hammer candlestick suggests that the downward movement is quickly coming to an end. Whether the stock rebounds or stays stable, the forces that caused the downtrend are no longer dominating. In fact, in order for the hammer to occur, the stock must make a significant gain to finish near where it started. This has significant short term implications for investments.
Your Next Move
It can be difficult to use the hammer to decide the next move. This is because this candlestick is only a weak indicator. The price may increase in the future or merely stagnate. In some situations, the downtrend may continue the next day, especially if the forces that slowed the fall were temporary. For these reasons, it is best to get confirmation before buying or selling stock based on this indicator.
Confirmation
There are a few situations that can confirm the bearish trend that the hammer suggests. On the next trading day, there may be an upward gap caused by the next day opening higher than the previous day’s close. A bigger gap is more persuasive evidence. Another solid confirmation would be if the next trading day closes with a white candlestick that is higher than the hammer. A hammer is always confirmed by an uptrend in price. However, if the price continues its previous downtrend on the next trading day, it’s possible that the hammer was not indicative of future movement.
Variations of the Hammer
The hammer can come in several different shapes, all of which have special significance. First, there is the length of the shadows. Long lower shadows suggest a more bullish future, while a long body or a longer upper wick suggests the very opposite. The hammer should also be interpreted according to previous trends in price. If the downtrend was sharp, there is a higher chance that this is a mere fluke. In this case, it is more important than ever to wait for confirmation before making any decisions.
Another factor that can strengthen or weaken the hammer is the color of the candlestick body. If the body is white, which means that the price was higher at closing that at the open, this is more indicative of a turn-around in the downtrend. A black body, suggesting a higher opening price, is not as strong. It’s important to understand this shape, know its context, and wait for confirmation before making decisions based on the hammer candlestick.


